The Power of the Dependencies
We cannot discuss data modeling without talking about normalization and functional dependencies. We already illustrated the mechanics of the process of
normalization in chapter 2. The objectives of eliminating malformed relational data designs are (roughly) these:
The starting point of his example is the list of non-normalized data Items for puppies:
Looking at the 5 rules it is evident that the processes are driven be the dependencies (between two concepts, really). It is also evident that there are two classes of dependencies / relationships:
normalization in chapter 2. The objectives of eliminating malformed relational data designs are (roughly) these:
- Reduce redundancy
- Avoid update anomalies
- Avoid information loss.
The starting point of his example is the list of non-normalized data Items for puppies:
- Puppy Number
- Puppy Name
- Kennel Code
- Kennel Name
- Kennel Location
- Trick ID 1..n
- Trick Name 1..n
- Trick Where Learned 1..n
- Skill Level 1..n
- Eliminate repeating groups
- Eliminate redundant data
- Eliminate columns not dependent on the key
- Isolate independent multiple relationships
- Isolate semantically related multiple relationships
Looking at the 5 rules it is evident that the processes are driven be the dependencies (between two concepts, really). It is also evident that there are two classes of dependencies / relationships:
- Intra-table dependencies, which is the classic functional dependency of properties, which "hang off" the key of some some object (type) identified by that key (color of a product, for example) , and
- Inter-table dependencies, where some object (type) is "pointing" to the key of another object (type), such as an employee working in a department.
Normalization by way of Visualization
Things would definitely be easier if the starting point was not a list of fields, but instead a concept map:
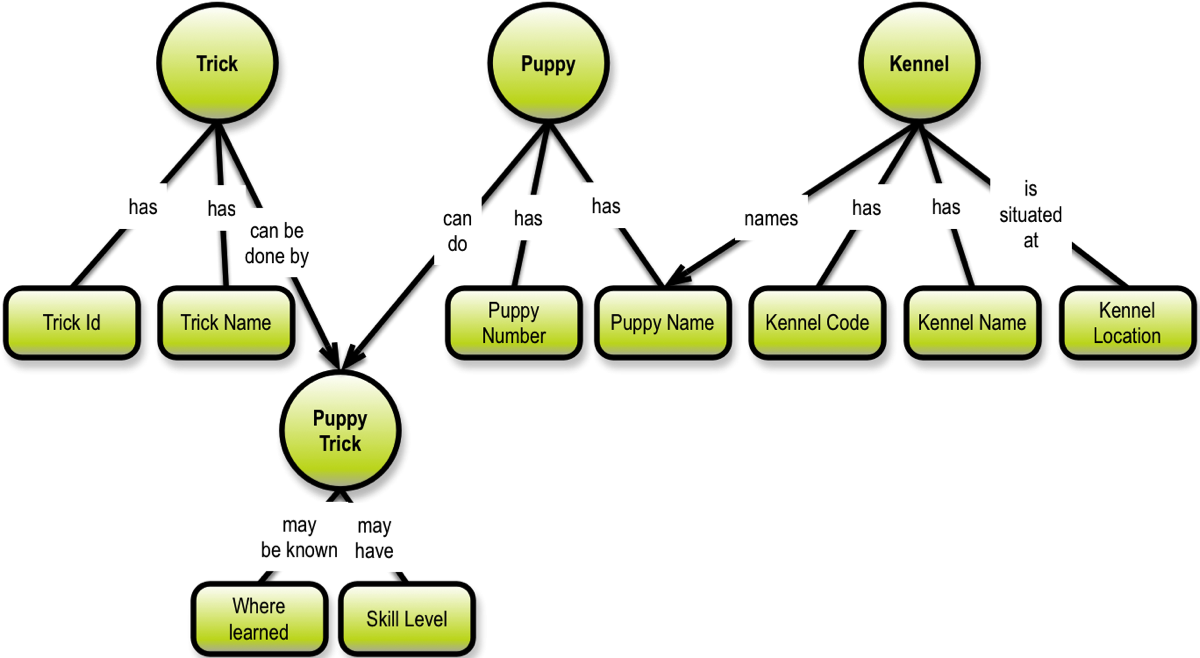
The way we arrive at a concept map like the above is based on the semantics (meaning) of the linking phrases. Some linking phrases determine a simple dependency (like “has”) on the unique identification of the object it is a property of. Other linking phrases contain action verbs meaning that they signify intra-object relationships (like puppy can do puppy trick).
It is obvious that depicting the dependencies as a directed graph gives a deep understanding of the functional dependency structure.
Given that graph visualization is the way forward (as argued so far in this book), is there anything we can carry forward from normalization?
The answer is simple: identity and uniqueness. These two things contribute hugely to setting the context in precise ways.
Read the Graph Data Modeling book for complete and comprehensive guidelines.
Check out this free webinar: Graph Data Modeling in Four Dimensions
You may follow the sequence or explore the site as you wish:
You could also take a look at the book about Graph Data Modeling: